A Year-End Perspective on Multifamily Operations, Labor, and Occupancy
By Les Leith, CEO & COO at National Doorstep Pickup
As we close out 2025, the multifamily industry stands at an important inflection point. The past two years tested operators with historic supply deliveries, labor volatility, rising insurance and compliance costs, and uneven rent growth, making it hard to call the specific phase we are in. Yet the data now points to something meaningful: stabilization.
From a national perspective, demand remains intact. Occupancy is holding near long-term norms, construction is finally decelerating, and the labor market—while still competitive for onsite roles—is becoming more predictable. As we enter 2026, the advantage shifts away from speculation and toward operational excellence, cost control, and resident experience.
This year-end statement is intended to give multifamily leaders a grounded, optimistic, and data-driven view of where we are—and how to win in the next cycle. We have 2016, ten-year lookback reflections on: Rent Growth, Transactions, and Development. Times have really changed!
What “Q3 / Q4-Current” Means for This Analysis
This perspective reflects the most recent publicly available data as of late 2025:
National Multifamily Housing Council (NMHC) Quarterly Survey of Apartment Market Conditions (fielded late September–mid-October 2025; released October 23, 2025)
RealPage national occupancy and class-level data through Q3–October 2025
Yardi Matrix national rent and occupancy reporting through November 2025
National Apartment Association (NAA) / Lightcast labor postings (Q1 2025, latest comprehensive public dataset)
Bureau of Labor Statistics (BLS) national wage growth through November 2025
NMHC does not publish labor data segmented by “A, B, C markets.” Where tiered comparisons are discussed, they reflect standard industry usage supported by national indicators and metro-level reporting from complementary sources.

An apartment owner at a new development reviews "2026 NOI Projections" on a tablet, showing his long-term financial outlook and investment in future growth.
The Big Picture Entering 2026
Demand Remains Durable. National multifamily occupancy averaged ~95.4% in Q3 2025, easing slightly from earlier peaks due to seasonal softness and supply digestion—but still well within historical norms. Residents continue to rent because affordability barriers to homeownership remain high.
Supply Is Finally Slowing
After record deliveries in 2023–2024, construction pipelines are contracting meaningfully.
New starts fell sharply in 2025, and deliveries are expected to decline further in 2026. This shift sets the stage for occupancy compression and reduced concession pressure—particularly in markets that absorbed peak supply earliest.
Capital Markets Are Selectively Re-Opening
NMHC’s October 2025 indices show improving sentiment for debt, equity, and transaction volume, even as market tightness remains loose. Dry powder is available—but only for disciplined operators with predictable NOI and strong operations.
Understanding A, B, and C Markets (Operationally)
While NMHC does not formally define A/B/C labor markets, this framework remains useful for operators:
A Markets (Primary / Gateway): High wages, deep labor competition, heavier regulation, and the highest concentration of Class A supply.
Examples: New York, San Francisco, Seattle, BostonB Markets (High-Growth Secondary): Strong migration, meaningful new supply cycles, and variable labor conditions.
Examples: Austin, Nashville, Charlotte, Atlanta, PhoenixC Markets (Tertiary / Smaller): More stable occupancy, less new construction, lower wage floors, and tighter operating margins.
Examples: Many Midwest and smaller Southeast metros
Q3/Q4-Current Metrics by Market Tier
Table 1: Demand, Labor, and Risk Indicators (Public Data)
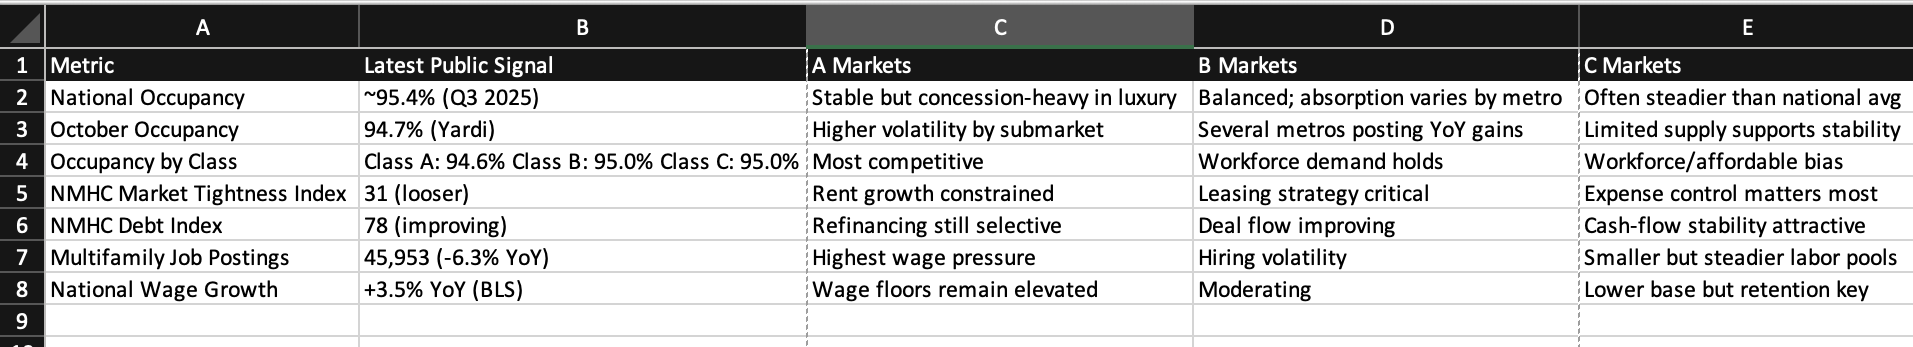
Q3/Q4-Current Metrics by Market Tier: Demand, Labor, and Risk Indicators (Public Data)
Labor Market Reality Heading Into 2026
A Markets: High Cost, High Expectation
Labor remains expensive and competitive. Even as national wage growth cools, gateway markets face structural cost pressure. Retention, training, and operational consistency will matter more than headcount growth.
B Markets: Volatility Requires Precision
These markets experience the widest swings. Operators must manage leasing velocity, onboarding efficiency, and resident satisfaction simultaneously—often amid heavy new supply.
C Markets: Stability With Less Margin for Error
Lower wages and steadier occupancy help, but revenue ceilings are real. NOI protection depends on minimizing controllable expenses and resident friction.
Occupancy by Asset Class (National)
Table 2: Occupancy Comparison (October 2025)
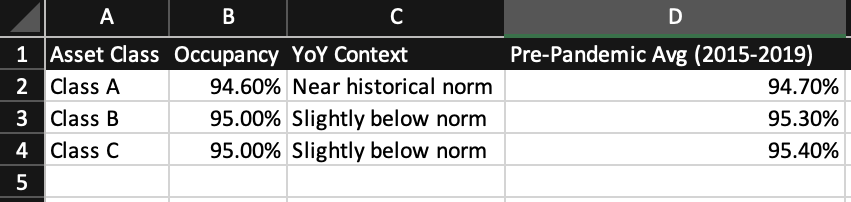
Occupancy by Asset Class (National) Table 2: Occupancy Comparison (October 2025)
Key takeaway: Class B and C continue to outperform on stability, while Class A requires stronger differentiation due to supply concentration.
What Is Being Built: Market-Rate vs. Affordable
A and many B markets continue to skew toward market-rate and lifestyle product, which explains current concession pressure despite solid demand.
C markets and smaller metros see a relatively higher share of workforce and affordable (including LIHTC) development, contributing to steadier occupancy and lower volatility.
This dynamic reinforces why operational efficiency—not just rent growth—will define performance in 2026.

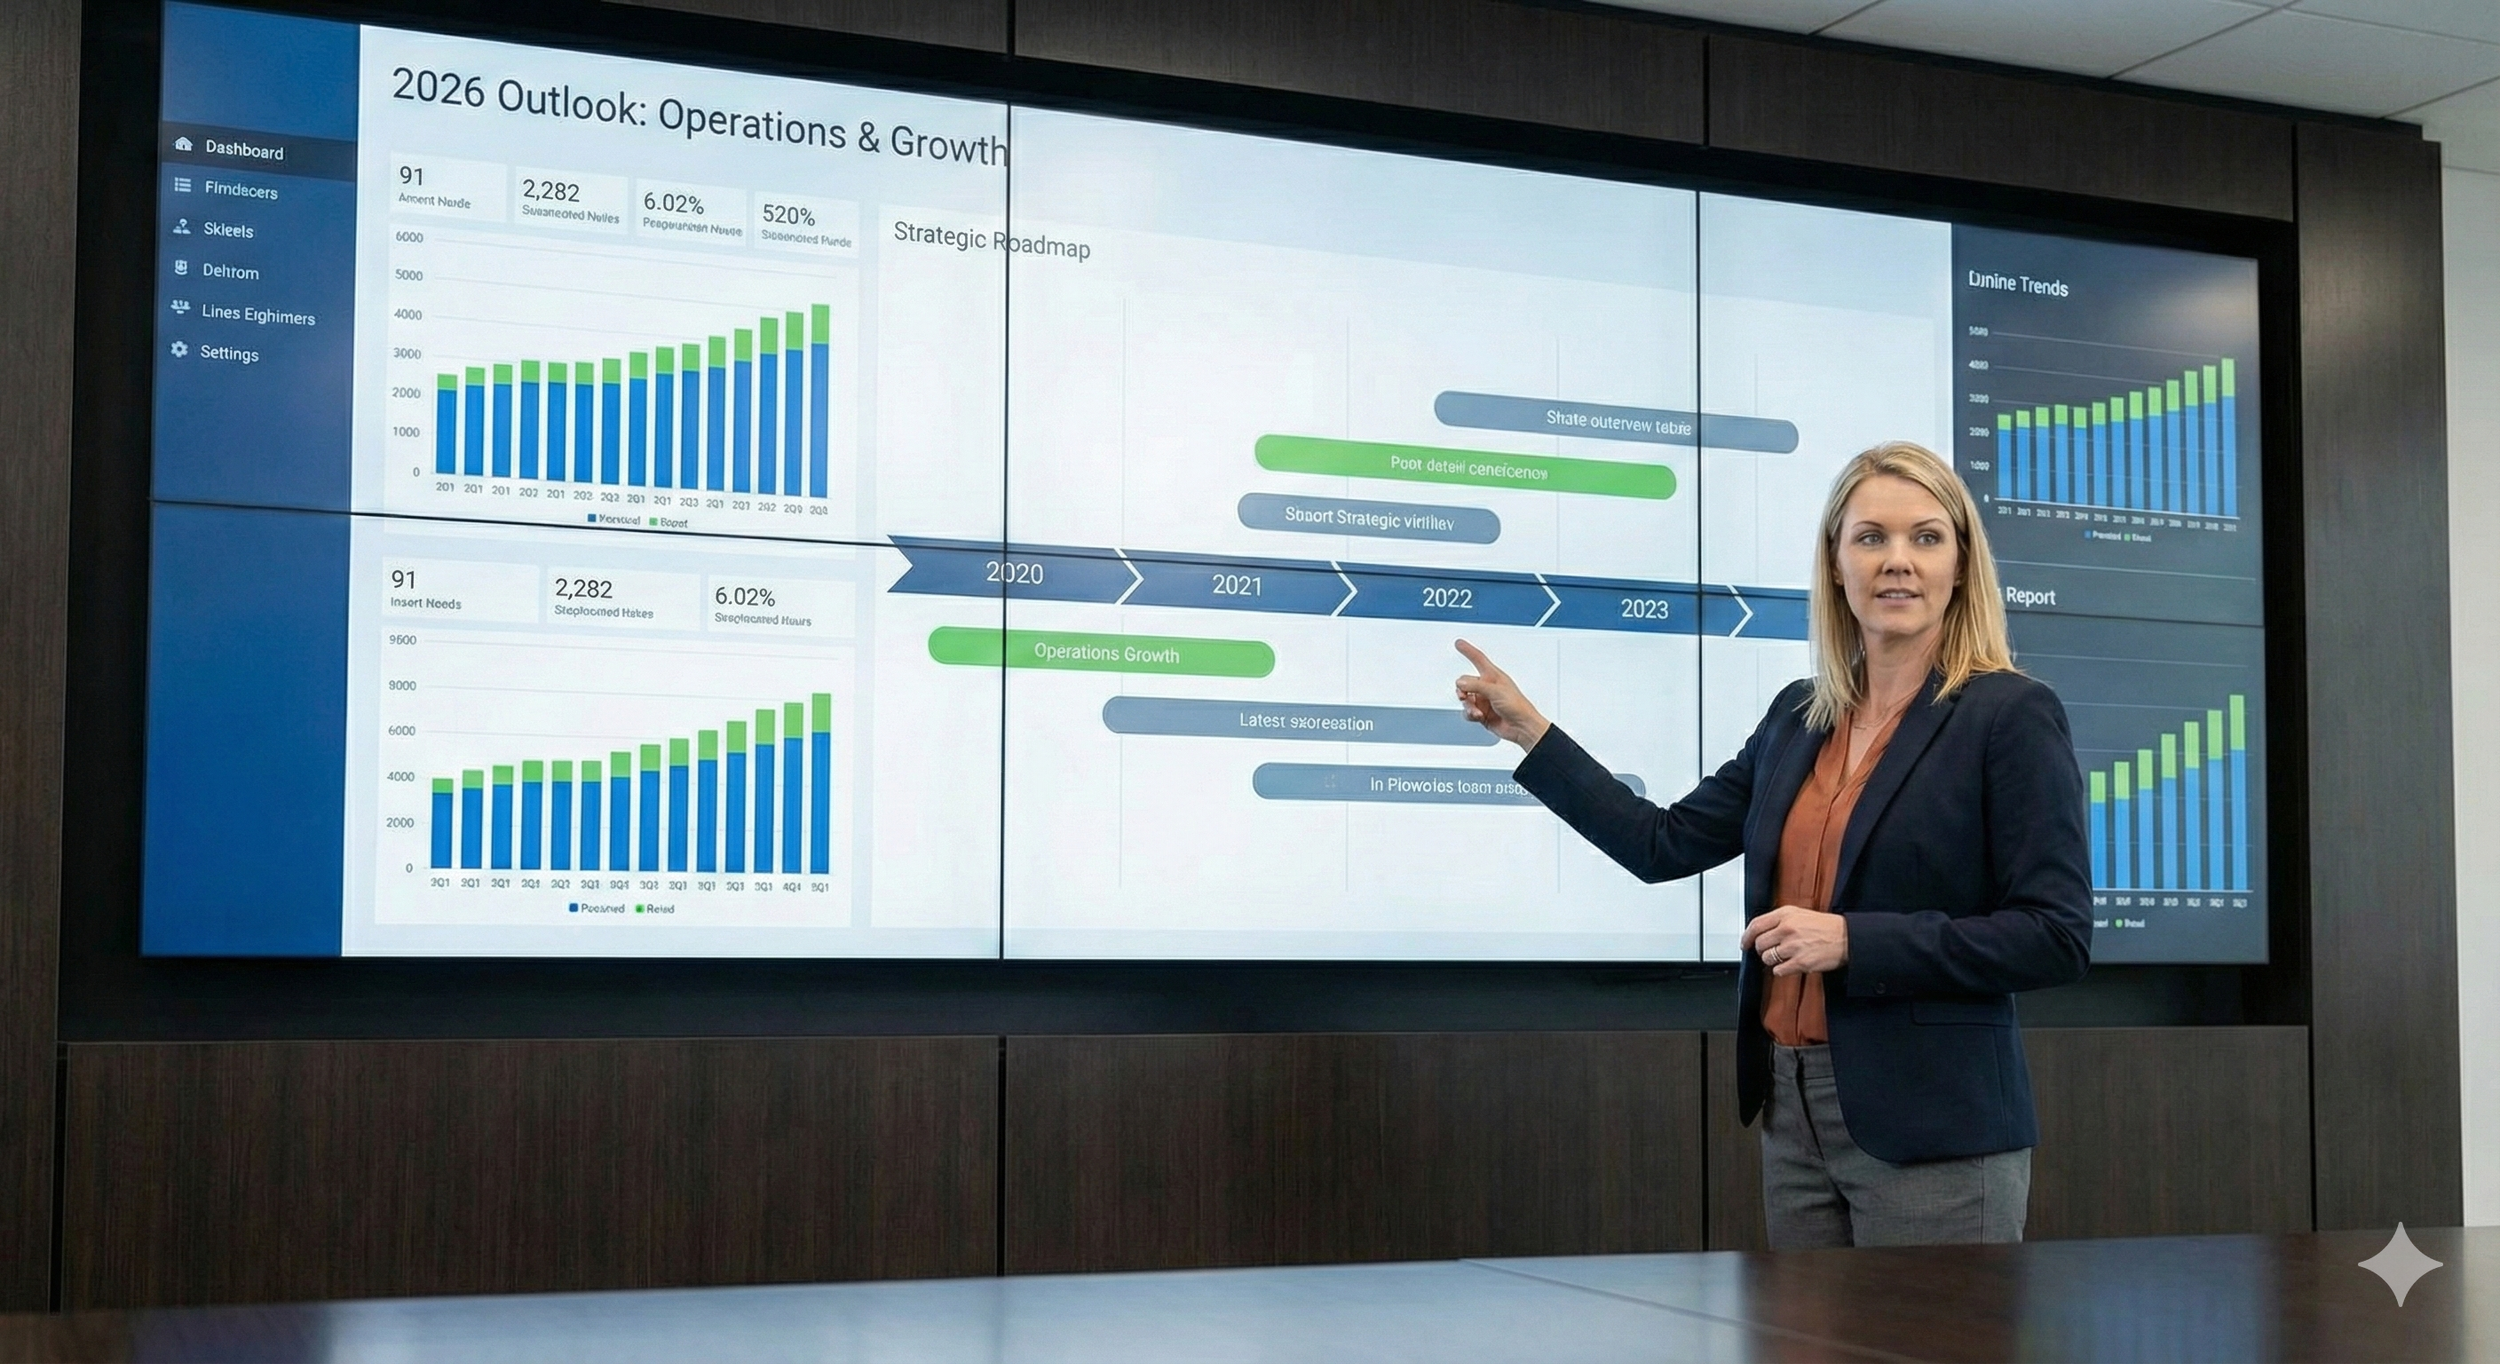
A female Sr. Regional Property Manager leads a team meeting, reviewing a "Labor & Occupancy Trends" dashboard to guide daily operations and improve property value.
Ancillary Services: A Strategic Lever in High-Vacancy Environments
When vacancy rises or rent growth stalls, the most effective ancillary services share three traits:
Immediate resident value
Measurable impact on retention and leasing velocity
Where Valet Trash Fits in the 2026 Operating Model
Valet trash is no longer just an amenity—it is an operational system that is resident-facing and combines sustainability and equity. The role of valet trash shifts from “nice to have” to “defend effective rent with operational cost reduction.”
In supply-heavy or concession-driven markets, valet trash:
Supports resident retention through daily convenience
Reduces pest issues, overflow, and after-hours maintenance calls
Enables better recycling and organics compliance at affordable and market rent assets
National Doorstep GreenPlus™
GreenPlus™ integrates valet service with compliance, education, and verification—helping properties:
Reduce contamination and protect hauling economics (fines and penalties)
Document diversion efforts as enforcement increases for huge turn-key Cash on Cash returns
In 2026, compliance alignment or repositioning focused on educating about green convenience will set operational leaders apart from reactive operators in total asset appreciation and valuation percentage gains!. With lower interest rates on the horizon, it’s best to be prepared for dispositions, acquisitions, and refinancing events in concert with portfolio efficiency audits!
Understand CoC Return and NOI Impact Before You Decide
To make the business case clear, we built the GreenPlus™ Profit Calculator, which allows you to estimate how a compliance-aligned doorstep program can reduce waste costs, lower risk exposure, and support NOI and CoC in your community.
Usually, the same company that picks up regular trash can also handle recycling for super cheap, since there typically aren't any tipping fees, which means HUGE savings, sometimes even a few tens of thousands or more per property. It’s really just about switching from a white bag to a blue one, but it must be clean!
Safety from rent softening!
View the GreenPlus™ Profit Calculator here:
https://www.nationaldoorsteppickup.com/greenplus-with-compliance-shield-calculator
A Realistic Note on “Top 50 Metro” Data
No comprehensive public dataset provides Q3 2025 occupancy rankings for all top 50 U.S. metros. Full tables typically require paid subscriptions to RealPage, Yardi Matrix, NMHC, and similar outlets. In an environment increasingly shaped by paywalls and large-scale data aggregation, E-E-A-T (Experience, Expertise, Authoritativeness, and Trustworthiness) has become non-negotiable. For complex, high-impact topics such as finance and multifamily housing, data platforms and search systems now prioritize verified, people-first content produced by credible industry operators—not generic or unsubstantiated summaries.
Trustworthiness is paramount, requiring transparent sourcing, current benchmarks, and real-world operational insight. Low-quality or unverified information introduces material risk. As a result, these systems apply significantly higher quality thresholds to financial and housing content to protect decision-makers from misinformation that could affect capital, compliance, or resident outcomes. Publicly available data supports some national trends and select metro highlights—but transparency requires acknowledging those limits.

An image showing a diverse maintenance and leasing team using tech like VR for training and data to plan staffing. The "2026 OPERATIONS OUTLOOK" dashboard appears in the background, tying labor to operations.
Closing Thoughts: The 2026 Advantage
The next cycle will not reward excess—it will reward execution.
The properties that outperform in 2026 will be those that:
Run predictable, efficient onsite operations
Protect NOI through controllables
Treat compliance as risk management, not paperwork
Deploy ancillary services residents actually use
At National Doorstep Pickup, we remain committed to helping multifamily leaders achieve exactly that—every door, every night, with compliance built in.
Les Leith
Chief Executive and Operations Officer
National Doorstep Pickup