NMHC Top 50 Rankings Just Dropped — Here’s What the Data Really Reveals About Multifamily Power Players
Based on research and analysis by Jay Parsons, Rental Housing Economist (Apartments, SFR), Speaker and Author
The latest National Multifamily Housing Council Top 50 rankings are out—and at first glance, it looks like a leaderboard of giants.
But look closer… and the real story is far more disruptive.
This isn’t an industry dominated by titans.
It’s one of the most fragmented, competitive, and opportunity-rich sectors in the U.S. economy.
Here’s what actually stands out—and why it matters for owners, operators, and investors trying to protect NOI and scale smarter.
1) The “Biggest Player” Barely Moves the Needle
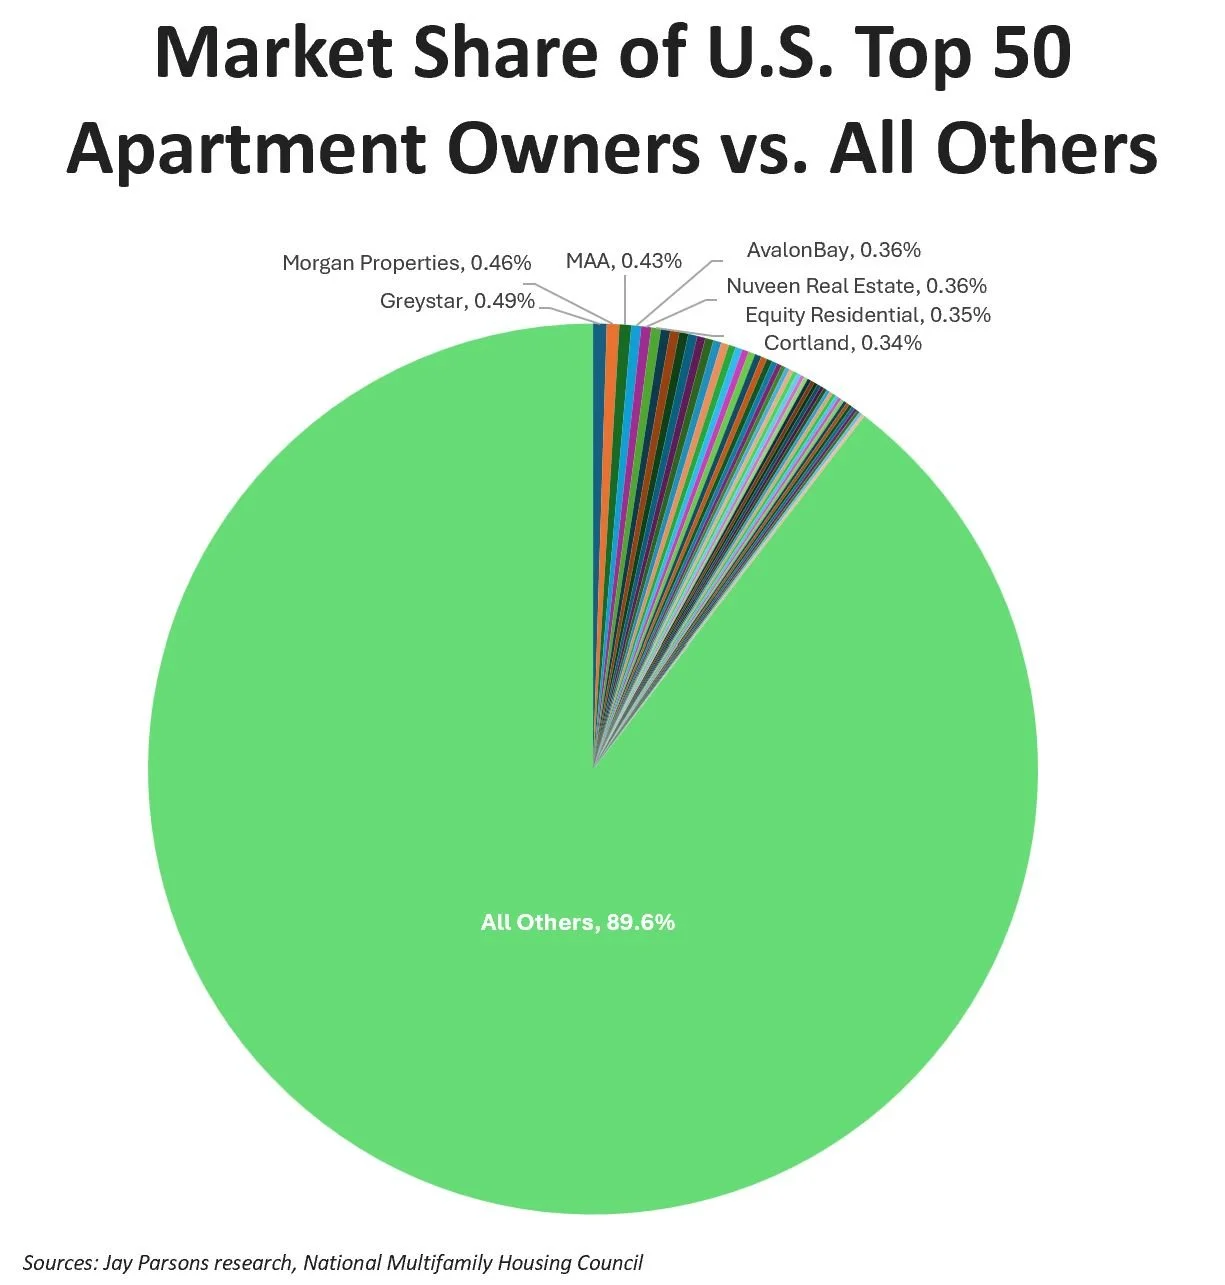
Let’s start with the biggest name in multifamily: Greystar.
Ownership market share: < 0.5%
Management market share: ~4%
Construction starts: ~2%
And that’s the #1 ranked firm across multiple categories.
👉 Let that sink in.
There are virtually no true “behemoths” in this industry. Compared to sectors like tech, retail, or airlines—where top players dominate—multifamily remains wildly decentralized.
Why it matters:
Competitive pressure stays high
Innovation isn’t dictated by a few players
Operators must differentiate at the property level—not rely on brand dominance
2) Ownership Is Fragmented—And Getting More So
Even at the very top, fragmentation is accelerating.
The Top 50 owners combined control just 11% of total units
In 2015:
8 owners had 100K+ units
The largest held 244K units
Only 3 owners exceed 100K units
The largest holds just 119K units
Meanwhile, Morgan Properties just entered the 100K club—adding 13,700 units.
So… why is ownership so fragmented?
Highly liquid transaction market
Low operational barriers (if capital is available)
Ability to outsource management to third-party firms
Bottom line:
Anyone with capital can enter—and scale—without building a full operational platform.
3) Big Developers Are Quietly Pulling Ahead
Development activity didn’t spike dramatically year-over-year—but something more subtle happened:
Top developers got busier.
What this signals:
Larger developers are leveraging:
Cheaper capital access
Operational efficiencies
Stronger pipelines
Meanwhile, smaller developers are facing tighter constraints.
Translation: Scale is starting to matter more—but only in development.
4) Management Is Where Consolidation Is Actually Happening
While ownership is fragmented, management is consolidating fast.
Top 50 managers now oversee ~5.3 million units
That’s a 6% YoY increase—likely a record
Why?
Margin compression is real
Cost pressures are rising
Larger operators deliver:
Better economies of scale
More efficient systems + staffing models
Key takeaway:
If you’re not scaling operations, you’re likely losing margin.
5) The Race for Scale: Who’s Winning in Management?
Greystar surpasses 1 million units managed
Asset Living adds 158K units, holding #2 with 446,427 units
Growth fueled by acquiring FPI Management
Other notable growers:
Arqline
ZRS Management
Each added ~20K+ units.
The pattern is clear:
Management is becoming a scale game
Ownership is still a fragmentation game
What This Means for Your NOI (And Why Most Operators Miss It)
This is where most people misread the data.
They focus on rankings.
They miss the operational implication:
In a fragmented ownership landscape, property-level performance is everything.
You’re not competing with Greystar.
You’re competing with the property down the street.
⚠️ The Hidden Risk in a Fragmented Industry
Fragmentation creates opportunity—but also risk:
Inconsistent operations
Inefficient labor allocation
Rising compliance complexity
Margin leakage across portfolios
And in a thin-margin environment, small inefficiencies compound fast.
🚀 The Operators Who Win in This Market Do One Thing Differently
They standardize and scale operational efficiency, not just acquisitions.
That means:
Reducing onsite labor drag
Streamlining waste + recycling logistics
Improving resident experience (without increasing headcount)
Protecting NOI through operational discipline
Review our 2026 Multifamily Outlook
Final Takeaway (From Jay Parsons’ Data)
The NMHC Top 50 data tells a very clear story:
Ownership = fragmented
Management = consolidating
Development = scaling advantage
Margins = under pressure
The winners won’t just be the biggest.
They’ll be the most operationally efficient.
Want to Compete Like the Top Operators?
If scale and efficiency are defining the winners…
Then your property-level operations need to evolve.